

How each player uses his assets and protects his liabilities dictate his success
story - not with-standing heart and desire.
Knowing one's assets and liabilities is one thing but knowing where they rank in
speed or performance relative to other hockey players is another. Assessing an opposition
player during game situations is done either through isolated private battles (wins and loses) or through visual assessment. A defenseman knows to
respect a player with exceptional speed. Likewise, a forward knows to take advantage of a slow pivoting defenseman by taking him wide.
The advantage of the Testing (CAT System) is that it allows a player to understand his strengths and weaknesses immediately. Through
my studies, testing has shown that the fastest players in the Junior and Pro
Hockey Ranks accelerate at approximately 22.2 feet per second over 30 feet (the fastest
player that I have tested over the 30 foot sprint test attained a 1.34 second
time - hence the animated number on the front page of this site) and 25.6 feet per second over 100 feet (3.91 seconds over 100 feet). In
contrast the fastest defending player accelerates backwards at 17.14 feet per second (1.75 seconds over 30 feet) and 21.5 feet per second over 100 feet
(4.65 seconds over 100 feet).
The fastest player forward accelerates at 2.22 feet each .10 of a second. The fastest player backwards accelerates at 1.75 feet
each .10 of a second.
If we were to translate this into a competitive situation pairing the two against each other (starting from the center line and finishing at the blue-line which is 30'), the forward would cross the line ahead of the defenseman by (subtracting the two times 1.75 D - 1.35 F = .40) approximately 9 feet (2.22 @ .10 of a second times .40). In a game situation the defenseman would have to respect the forward by creating a gap of approximately 9 feet (slightly more or less). Of course lateral mobility, pivoting and crossover skills would have to be taken into consideration to recreate a real game model but for our purpose this provides us with a good working example. This discrepancy becomes more noticeable when comparing other game situations. Take the forward sprint test (fastest @ 2.48) and the backward to forward pivot test (fastest @ 3.01) for example.
Forward Medial Distance Test' @ 24.19' per second - Forward to Backward Pivot
Test' @ 19.9' per second Result: Forward would beat the Defending player by almost 13 feet if they
started together (if we were to use the neutral zone for demonstration
purposes).
In the previous analysis we are taking into consideration only the fastest and
most skilled players tested and pitting them against each other. If we were to compare the fastest players against the average player pool, the results would
be far more evident.
For example the average time for the backward sprint test for defensmen at the Junior A tier 2 level is 2.05 seconds. Comparing this
against the fastest forward player would have the forward crossing the line (2.06 average backward time minus
1.34 fastest forward time = .71 seconds multiplied by 2.22 feet per .10 of a second equals) approximately 16 feet
ahead. This difference of 16 feet is quite dramatic. The average backward skater would just attain the halfway point before the elite forward player
finishes.
If we were to take the average backward to forward pivot time for defensmen at the Junior A - tier 2 level at 3.40 seconds and compare it to the
fastest forward time in the medial distance test at 2.48 seconds the forward would cross the line
(3.40 - 2.48 = .92 x 24.19 ft/sec =) 22.25 feet ahead.
Interesting enough is the fact that while many players think they know who the fastest player on their team is, they are the vast majority of the time
WRONG (I frequently asked the players being tested who they thought were the
fastest skaters in the short and long forward sprint tests to which they always
had an answer). When asking the players who they thought was the fastest backward skater,
I seldom got any answer at all and most certainly a forward was never mentioned.
What does this information translate into for the coach?
Take some of the skating skill match-ups evident during game play:
1 - Forward acceleration
versus
Backward acceleration
2 - Forward speed
versus
Forward speed
3 - Tight turn
versus
Backward to Forward
pivot (direction change)
4 - Backward to Forward Pivot
versus
Forward speed
5 - Stop / Start
versus
Backward to Forward
pivot (direction change)
6 - Forward Crossovers
versus
Forward Crossovers
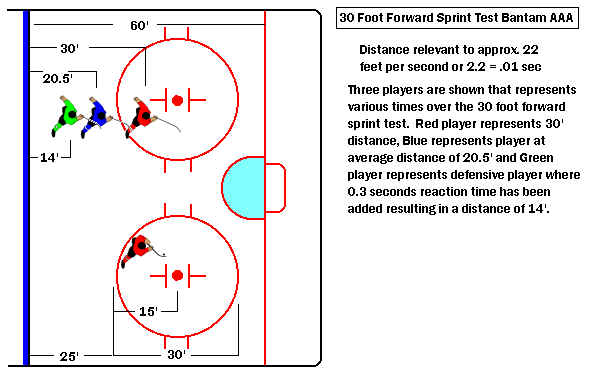
Provided in the next few pages is a visual representation of how the numbers (player's test times) translates into "on-ice" performance.
The diagrams shown below are to create a visual connection between a timed value (skating test result) and its' relevance to space
or distance as well to other comparative values.
30 Foot forward Sprint Timed Values
(N) Novice (8, 9 yrs) - 1.96 seconds (B) Bantam (13, 14 yrs) - 1.37 seconds
(A) Atom (10, 11 yrs) - 1.66 seconds (M) Midget (15, 16 yrs) - 1.34 seconds
(P) PeeWee (12, 13 yrs)- 1.50 seconds (J) Junior (15 - 20 yrs) - 1.38 seconds
(P) Pro (18 + yrs) - 1.40 seconds
60
Foot Forward Sprint Timed Values
(N) Novice - 3.42
seconds (B) Bantam
- 2.65 seconds (P)
Pro - 2.60 seconds
(A) Atom - 2.98 seconds (M) Midget - 2.71 seconds
(P)
PeeWee - 2.74 seconds (J)
Junior - 2.59 seconds
The above diagram represents acceleration comparisons between divisions. The left side of the diagram
represents player positioning at the 1 sec point of the test relative to the fastest players timed within each
respective division. The right side of the diagram represents player positioning relative to location where the
fastest timed player crosses the finish line after the 60 foot sprint. These comparisons demonstrate the
differences in short and medium distance acceleration. As players mature and musculature and bone mass
increase, speed relative to time translates into power. For example, the following numbers represent a random
selection of 100 players and the averages of their combined weights:
Atom Elite: 92 lbs
PeeWee
Elite: 119 lbs
Bantam Elite: 151 lbs
Midget Elite: 169 lbs
Junior A Tier 1: 176 lbs
Pro
193 lbs
Weight becomes a very important factor relative to speed. My research has shown that the fastest players
generate a force of approximately 2.2 times their body weight during the 30 foot acceleration test.
Proper leg training obviously plays a critical factor in performance. Shown
below is the body weight in pounds relative to the fastest player tested in
their respective division.
For example:
Atom : Accelerates at
18.07 ft/sec 92
lbs x 2.2 = 202.4 lbs/torque
PeeWee: Accelerates at
20.0 ft/sec 119
lbs x 2.2 = 261.8 lbs/torque
Bantam: Accelerates at
21.89 ft/sec 151 lbs x
2.2 = 332.2 lbs/torque
Midget: Accelerates at
22.38 ft/sec 169 lbs x
2.2 = 371.8 lbs/torque
Junior A: Accelerates at
21.73 ft/sec 176 lbs x
2.2 = 387.2 lbs/torque
Professional: Accelerates at 19.86 ft/sec
193 lbs x 2.2 = 424.6 lbs/torque*
*number of professional players tested numbered approximately 225 players.
Fastest Clocked Time Average Clocked Time
(N) Novice (8, 9 yrs) - 1.96 seconds - 2.26 seconds
(A) Atom (10, 11 yrs) - 1.66 seconds - 2.14 seconds
(P) PeeWee (12, 13 yrs) - 1.50 seconds - 2.55 seconds
The above diagram represents a division to division comparison. The relevance of speed is critical to each
level. The gap between players represents the variance created over a 30 foot distance between the fastest
players timed per division and the average (50%) player within the same division. The importance of
over-speed
training (training for speed out on one's comfort zone - maximum potential where
form and control is hard to maintain) is critical. This is demonstrated clearly by the diagram representing the PeeWee division (12, 13 years
of age). Weaker skating skills at the younger levels (Novice - 8,9 years of age) demonstrates the importance of
good all around fundamentals. The gap between the fastest and average player closes again at the levels above
PeeWee. The gap remains fairly constant at the Bantam and Midget Divisions (14, 17 years of age) and begins
to close quickly at the Junior and Professional ranks as shown below.
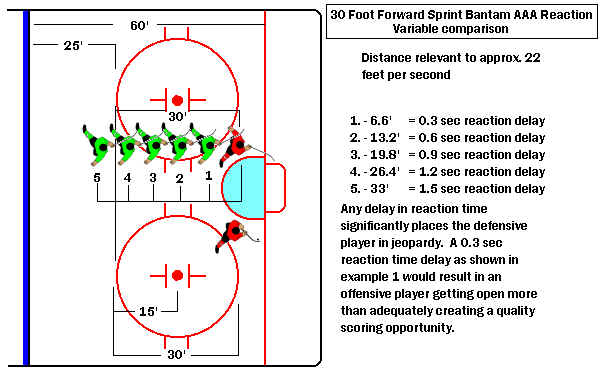
With the gap between the average and the elite player closing substantially, capitalizing on an opportunity
where open ice is created is very important. It must be stated that these comparisons are shown minus reaction
time. Gap is shown where players have left starting line at the same time. Where a defensive player is placed
in a reactionary role, 2 or 3 tenths of a second can make all of the difference as shown
below.
Fastest Clocked Time Average Clocked Time
(B) Bantam (13, 14 yrs) - 1.37 seconds - 1.82
(M) Midget (15, 16 yrs) - 1.34 seconds - 1.79
(J) Junior (15 - 20 yrs) - 1.38 seconds - 1.60
(P) Pro (18 + yrs) - 1.40 seconds - 1.70
This diagram places a player's reaction time into the equation. If we were to add only 3/10s of a second to the
time of the average skater quite a gap is created between the two players. From this model we can see the
importance of explosive acceleration training within the practice system. One of the main problems within a
practice environment is the focus on the main body of the drill as opposed to the beginning. Players are allowed
to "ease into" the drill focusing only on speed once the flow of the dill has begun.
Quick starts aid in the development of reactionary skills. How much of a gap is required for the offensive player
to generate a good scoring opportunity is dependant on the skill of the player.
Mere 10ths of a second make all of the difference in a game that focuses on speed and opportunity!
Teaching Power Skating and Hockey Skills for the past 20 years, I have demonstrated that there are two distinct styles of skating relative to body alignment. Defensive posturing as well as Offensive posturing. Lack of or possession of quick reactionary skills is directly related to several micro skill set fundamentals which I will not get into here but of course will offer at a later time. This study explained why there are great defensive as well as offensive players. Again, if you look at my front page again where I explain the success of my Bantam AAA team, you should begin to comprehend the relevance of this information either specific to an individual role player or to an overall team system.
In the diagram shown below, comparison is made between forward and backward acceleration. In the diagram
on the left, the fastest forward per division is paired against the fastest defenseman. Positioning demonstrates
the gap necessary if players were to cross the finish line at the same time. In the diagram on the right, forwards
are paired against average defense. Average places the defenseman within the 50 percentile. Again, the
defense is placed in a reactionary position. If we were to add 3/10s of a second to the time of the defensive
player, as shown as "player X", additional gap is created. This demonstrates the importance of anticipation and
reaction skills.
Problems with backward acceleration impact a team's success at the offensive
blue-line. Containing the puck becomes a problem and in effect eliminates 1 or even 2 players from the play within the zone. As opposed to
thinking of offensive, mental focus becomes primarily concerned with defense with defenseman leaving the
zone early.
When more complex skills such as pivoting are taken into consideration, discrepancies in performance are
very evident. Backward to forward pivots are primarily a function of leg speed and flexibility as opposed
to explosive power which involve the larger muscles of the legs. Technique is the foundation of this basic
fundamental. Speed lost during the pivot effects forward momentum. In order for a defenseman to be
effective in a one-on-one confrontation, superior skills in backward acceleration (maintains gap), good
overall backward skating speed, and efficient pivoting are necessary.
The diagram shown below shows the position of players within their respective divisions relevant to the fastest
clocked time where player was crossing the finish line.
The following comparison below represents forward crossover testing. Positions of players would demonstrate position relative to skating the perimeter of one of the face-off circles shown inside the diagram and reflect performance for each Division..
Following is a comparison versus average player times relative to each respective division.

PeeWee AAA Cross-over Comparison - Fastest versus Average
PeeWee AAA Percentage Comparison
Bantam AAA Cross-over Comparison - Fastest versus Average
In
the above diagrams, we again show a comparison between the fastest and the average timed
Rep player.
The fastest timed player accelerates at approximately 19.54 feet per second while the average player only
accelerates at 16.3 feet per second.
What is important to note in all of the examples shown is that comparisons are made respective to both players
starting at the same time.
Distances are specific to reaction time during game situations. Every 10th of a second is absolutely critical
to maintaining man-on-man coverage. Quick acceleration creates an immediate "reaction gap". Therefore, the only way that an inferior skater can compensate is to have superior "anticipation" skills. The importance of a player possessing the ability to read and react to the play cannot be understated. It becomes, in a game designed for speed, a critical part of a player's make-up.
We have established a correlation between time and distance. A player's time becomes a tool from which we can compare one player against another or a player against a group of players. This type of comparison
creates a ranking system from which we can establish bench marks to gauge performance.
This diagram represents players positioning relative to ranking or percentile. The fastest player would be ranked as 100% and all other players would be positioned accordingly.
It is important to create a clear picture of a player's true skating potential. A common mistake that players make is that they do not understand their limitations. Skating ability is specific to time and distance. There are several other factors that we have to consider:
1 - A player's ability to read the play and anticipate movement.
2 - A player's reaction skills or inherent reflex.
Midget AAA Cross-over Comparison - Fastest versus Average
Midget AAA Cross-over Comparison - Fastest versus Average
Reaction time is a critical component of a player's makeup. If we translate reaction time into distance we
can further understand why read and react and anticipation skills are so important.
Forward Crossovers
Atom:
Novice:
100% = 18.5 ft/sec
100% = 16.99 ft/sec
50% = 15.2 ft/sec
50% = 14.7 ft/sec
.1 of a sec. = 1.52 ft
.1 of a sec. = 1.47 ft.
PeeWee:
Bantam:
Midget:
100% = 19.54 ft/sec
100% = 20 ft/sec
100% = 20.86 ft/sec
50% = 16.30 ft/sec
50% = 17.66 ft/sec
50% = 18.16 ft/sec
.1 of a sec. = 1.63 ft.
.1 of a sec. = 1.76 ft.
.1 of a sec. = 1.82 ft.
Junior Tier 2:
Professional:
100% = 21.09 ft/sec
100% = 21.09 ft/sec
50% = 18.73 ft/sec
50% = 18.82
.1 of a sec. = 1.87 ft
.1 of a sec. = 1.88 ft
The above times reflect only 1/10 of a second. While space is limited we can see by increasing the time value that a player has to react, space or distance increases relatively.
Again, the figures are specific to forward crossovers
testing analysis:
PeeWee:
Bantam:
Midget:
100% =.1 of a sec. = 1.63 ft.
100% = .1 of a sec. = 1.76 ft. 1
100% = .1 of a sec. = 1.82 ft.
.2 = 3.26 ft
.2 = 3.52 ft
.2 = 3.64 ft
.3 = 4.92 ft
.3 = 5.28 ft
.3 = 5.46 ft
.4 = 6.42 ft
.4 = 7.04 ft
.4 = 7.28 ft
.5 = 8.15 ft
.5 = 8.8 ft
.5 = 9.1 ft
Junior Tier 2:
Professional:
100% = .1 of a sec. = 1.87 ft
100% = .1 of a sec. = 1.88 ft
.2 = 3.74 ft
.2 = 3.76 ft
.3 = 5.61 ft
.3 = 5.64 ft
.4 = 7.48 ft
.4 = 7.52 ft
.5 = 9.35 ft
.5 = 9.4 ft
What is particularly interesting is that as coaches we work on reactionary
drills very little, but instead focus on system or pattern recognition
drills. My research has shown that the average player (and I am going to
very generic here because of the volume of information) at the Junior Level was
5/10's of a second.
By analyzing the above information, we can see that the elite player has a real advantage over an
untrained and unskilled player. Once an advantage has been gained, due to the fact that these scores
represent the top players, weaker players can never catch up. When considering offensive systems
that incorporate cycling, a team that is slow to react out of the corners will find themselves on the
wrong end of the score board.
Considering that these scores are relative to "CURVE" acceleration, straight ahead speed amounts
to even greater distances.
Testing has shown that superior short distance speed is absolutely critical to a team's successful
deployment of defensive and offensive systems. Short distance training helps to develop a player's
read and reaction skills which again translate into opportunities relative to
distance as shown below in the Game Simulation Diagrams.
As we can see, reaction time plays a critical role in offensive as well as defensive play. If we increase reaction time, as the following diagrams demonstrates, the ensuing result is obvious.
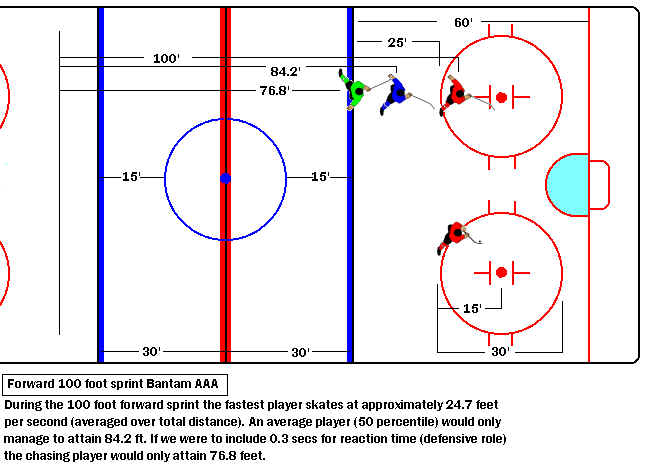
Bantam 100 foot sprint Game Simulation Diagram
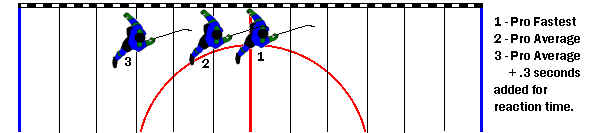
Pro Reaction Game Simulation Diagram
We can see that as well move up through each level, speed relative to overall group increases which impacts dramatically time and space.
The chart below represents a
comparative analysis between the top 5 and bottom 5 tested goal-scorers in
the Junior hockey league tested relative to point production per game played.
Top 5 Players - Total points represented:
559
Bottom 5 Players - Total points represented: 31
Top 5 represented:
Ht Wt
Pos. GP Gls. Ass.
Pts/Gm.
Player 1. 6'3 200
RW 39
34 51
2.18
Player 2. 5'9 155
C 58
58 64
2.10
Player 3. 5'6 165
C 60
42 81
2.05
Player 4. 5'11 175
C 58
60 55
1.98
Player 5. 5'10 180
C 60
51 63
1.90
Totals
245 Goals 314
Assists = 559 points
Bottom 5 represented:
Ht Wt
Pos. GP Gls. Ass.
Pts/Gm.
Player 1. 5'7
165 C
57 5
5 . 09
Player 2. 6'0
175 C
57 2
7 .04
Player 3 . 6'0
205 RW
42 2 3 .05
Player 4. 6'0
165 RW
55 2
3 .04
Player 5. 6'1
210 LW
22 0
2 .01
Totals
11 Goals 20
Assists = 31 points
I compiled all testing data for each group ranging from backward acceleration to forward short, medium and long game speed, from crossovers left and right to stop/starts. After analyzing the information I was shocked to see that what players have been told for years as the primary focus for their power skating was indeed wrong. The skills were so dramatically different between the top and bottom group that in the first comparison the top group was an amazing 25% better. In the second skill comparison, the top group was again an astonishing 23% better. These figures in comparative performance resulted in the point production shown above.
The following chart demonstrates a fundamental comparison between overall skating tests, forward speed tests and transitionary skating skills.
However,
not all transitionary skills had tremendous impact. The above represents a total
of all such skills, but when isolating specific elements comparatively, the
impact on performance becomes even more dramatic!
Based on the research analysis of the above information relevant to the testing performed, I was able to create a training program for my 15-16 year old for both on ice as well as off ice that allowed us to win the Western Canadian Bantam Hockey Championship, the first time that a team from British Columbia, Canada, had done so in over 20 years). As well, it allowed us to win the Medicine Hat Alberta International Invitational Bantam Tournament, the first B.C. team to ever do so in the history of the tournament.
What were the relevant skills or tests, you will have to wait and see!!!
More later.
Ron
Johnson
Ron
Johnson, President, Technical Director Quan-Tech Sport Systems Inc.
Copyright © 1996 by Ron Johnson. All rights reserved.
Revised:
04 Nov 2009 08:40:29 -0800
.