COMMENT PAGE - just some more thoughts, this time on signing and cutting players.
Updated on the 10 of Sept., 2002
It is getting to that time of the year when players are trying out for all the difference Junior and / or rep teams around the lower mainland. Each player is trying to present himself in the best possible way so as to show that all the hard work of the summer training regiment has made him a new and improved player.
Why I said new and improved is that most players have been scouted for the last few years and if you are in the top two lines in your hockey club (minor hockey, Junior A, B etc), most teams above have put together quite a file on your ability to perform, compete, etc. Coaches, scouts, GMs know what you need to improve on and they want change......for the better.
Unfortunately, most players do not have a clue as to what they need to improve on, especially if they are on the top two lines of one of the above teams. Most players in this position are usually to full of themselves, especially since they can see that they are on top of the pecking order and have been told one to many times how good they are.
I encourage players to have the courage, no matter what the level, skill or otherwise, to ask questions about their performance and constantly evaluate themselves. All top businesses do this on a constant basis. How else can you measure your performance, course direction and success. IT TAKES MANY YEARS TO BECOME AN ACCOMPLISHED SKILL PLAYER!!!
Coaching Junior hockey and having to go through the tryout process, talk to players, recruit players, talk to parents, I am constantly amazed at the complete ignorance that exists out there about how to move upwards through the developmental process and into the team selection process onto a hockey club and especially what coaches and scouts look for. Now, I am now saying here that the process shown below is everyone, but I tried to explain as simple as possible and in picture form, some basic comparisons.
So to restate the above; what I have done is to try to create a visual concept of how a coach, myself in particular,
actually compares player to player within my league.
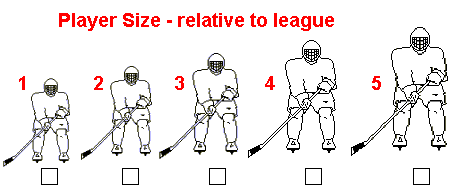
1 - Player size (not important really but just a reference point for the rest of the comparison) relative to players within the league.

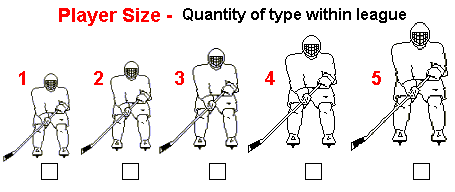
2 - Average size of players within the league or quantity of players of that size within the league. Example:
A particular team may be described as 1x1, 2x2, 5x3, 7x4, 3x5 (total of 18 forwards/defense). This may describe teams within the league as well.
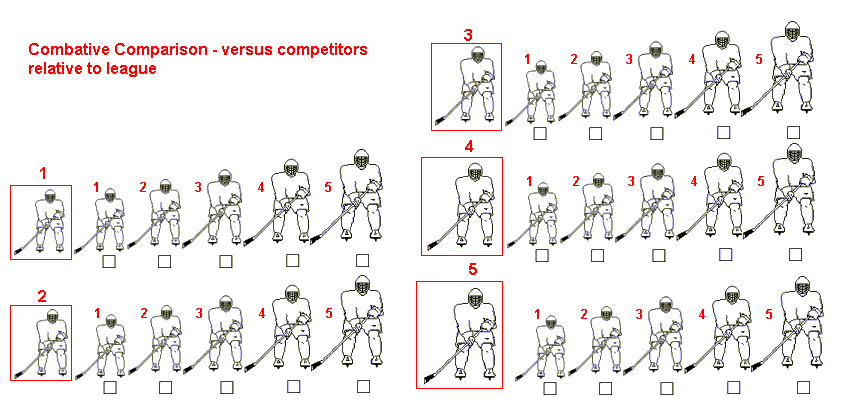
3 - Size is not really a factor (or it shouldn't be) but how a player performs relative to his competition is. The diagram below represents this. Having rated a player above in relative size compared to overall league, I then compare his combative (one on ones) skills versus players smaller, same size or bigger. Rate perform based on hitting, competing for pucks, in front of the net, etc. Looking at the above chart and comparing performance against a team in particular or, overall league, a player may have success competing against a majority of smaller players (1,2) but average to minimal success against players (3-5). Thus, performance competing against larger players who dominate the league becomes a liability and pulls him out of the game.
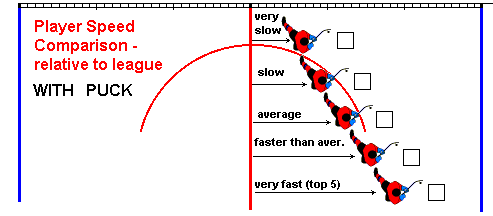
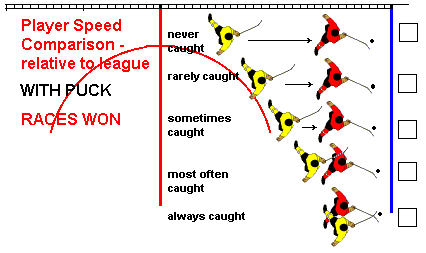
4 - The diagram below represents a comparative analysis based on skating speed with the puck versus comparative players within the league.
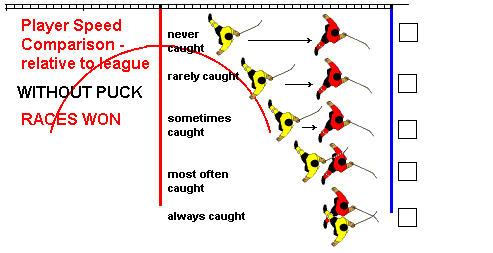
5 - The player is then compared by analyzing races won against relative checking players within the league based on their speed. As shown (relative to players within the league - don't forget), never caught to always caught.
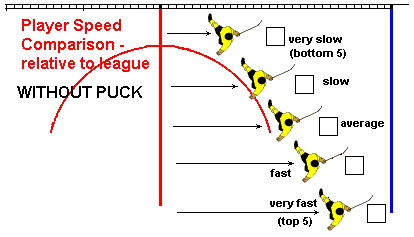
6 - It stands to reasons that some players are faster without a puck than they are with a puck and this in its self can be useful. Again, comparison is made against players within the same league.
7 - Again, did you as a player always get caught (with few exceptions) as below or never caught as top demonstrates.
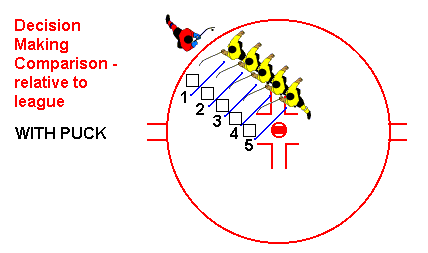
8 - And, how does a player make decisions. Decisions, quality of especially is all relative to space. Shown below is an example of critical space. How much room does a player need to make a quality decision within the league desired. If a player cannot make a quality decision under proximal pressure (1) or (2) then in a game where faster players are utilized, success becomes minimal.
The following diagrams are for defensemen.
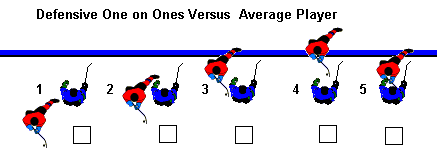
9 - Shown below are one to one comparisons. The first diagram is versus the average skating forward.
1-always beat 2 - almost always beat 3-sometimes beat 4-rarely beat 5-never beat
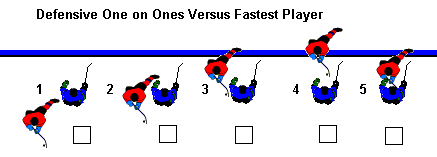
10 - The next comparison is versus the fastest skating forward.
1-always beat 2 - almost always beat 3-sometimes beat 4-rarely beat 5-never beat
11 - The next comparison is versus the average skating forward.
1-always beat 2 - almost always beat 3-sometimes beat 4-rarely beat 5-never beat

12 - The next comparison is versus the strongest skating forward.
1-always beat 2 - almost always beat 3-sometimes beat 4-rarely beat 5-never beat

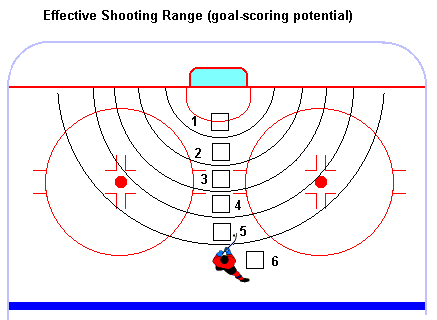
13 - Shooting skills. In this comparison, I am looking for effective shooting range (power, accuracy, timing, anticipation, etc). When most teams collapse the zone, a effective outside shooter is critical to open up the zone.
Hopefully, the above information will shed some light on why cuts take place. Sometimes, it just comes down to; too many power forwards, too many right hand shots, too many short range shooters. You get my drift here. The first rounds of cuts generally break down into one of the 4 basic rules;
1 - speed
2 - strength (combativeness)
3 - thinking speed
4 - skill level
Copyright 1996 Ron Johnson All Rights Reserved